
Class 5: Maths Chapter 12 solutions. Complete Class 5 Maths Chapter 12 Notes.
Contents
NCERT Solutions for 5th Class Maths Chapter 12- Smart Charts
NCERT 5th Maths Chapter 12, class 5 Maths Chapter 12 solutions
Page 159
Chi-Chi, Meow-Meow
Yamini did a project ‘Animals and Birds’. She asked each child of her class about one favourite pet animal.She used tally marks to record each answer. For example if someone said ‘cat’ she means 5 cats.In all 24 children said ‘cat’ was their favourite animal. Help Yamini complete the table.
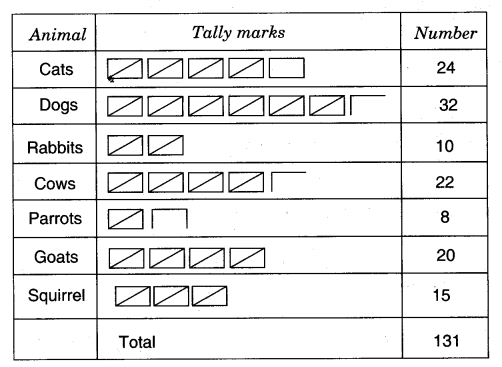
one line in front of ‘cats’. When someone said ‘cat’ again, she added a line. So f means two cats and
(a)Look at the tally marks and write the number for each animal in the table. How many children in all did Yamini talk to?
(b)Which is the most favourite pet animal in this table?
(c)Which pet will you like to have? What will you name it? Which other animals can be kept at home? Discuss.
Ans. The complete table is given above
(а)Yamini talked to 131 children.
(b)Dog is the most favourite animal in this table.
(c) I would like have a dog as a pet. I will name it ‘Tiger’. We can also keep cats and parrots as pet, if we live in cities. We can keep cows and goats also if we live in a village.
Page 160
Making Tally Marks on the Road
Sumita stood on the road for half an hour and counted the number of vehicles passing by. She made a tally mark for each vehicle. This helped her in counting the total number of vehicles in each group. !
(a)Write the number of each vehicle in the table.
(b)How many vehicles in all did Sumita see on the road in half an hour.
(c)Autorickshaw are thrice the number of trucks. True/False?
(d) Make tally marks for 7 more buses, and 2 more trucks.
Ans. (a) Number of eachjvehicle is shown in the table.
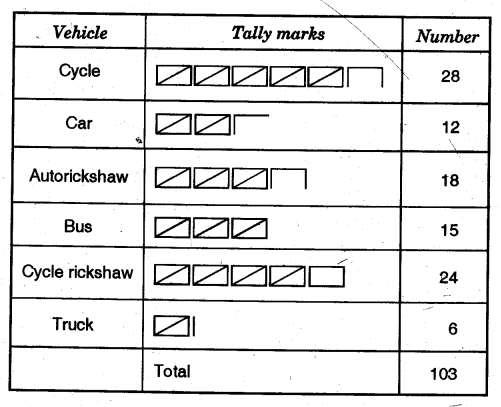
(b)Sumita saw 103 vehicles in half an hour.
(c)False
(d) Tally for 7 more buses:

Tally mark for 2 more trucks:

NCERT 5th Maths Chapter 12, class 5 Maths Chapter 12 solutions
Page 161
Try Yourself
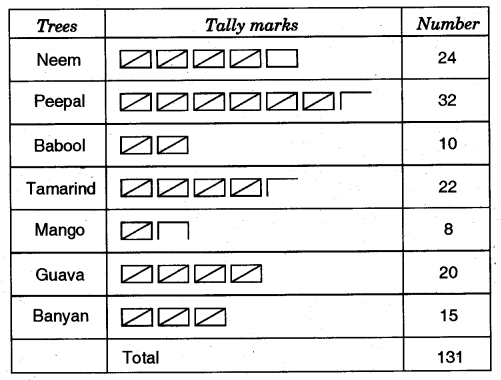
1.Take a round in your colony. Find out how many types of trees you can see there. Do you know their names? You can make drawings. Use tally marks to note the number of different trees.
Ans. I found many types of trees. I know their names. These are; Neem, Peepal, Babool, Tamarind, Mango, Guava and Banyan. Tally marks for these trees are given in the following table.
Page 162
Helping Hands
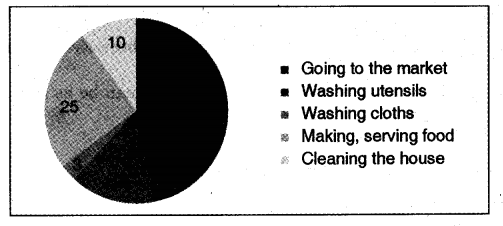
1.In the EVS period, the teacher asked children whether they help their parents at home. There were different answers. Children named the work in which they help their parents the most. The teacher collected their answers and made a table.
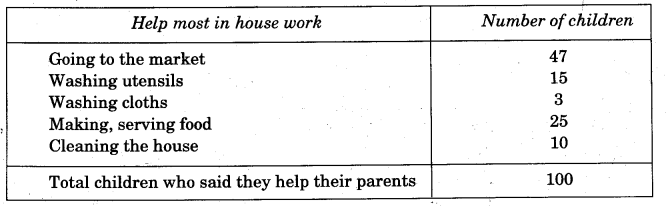
Now, you can fill the chapatti chart to show the numbers given in the table.
Ans. The chapatti chart is given below.
Page 163
Look and Find Out
1.Children who help in making or serving food are:
(a)One-third of the total children
(b)Half of the total children
(c)One-fourth of the total children
Ans. (c) One-fourth of the total children
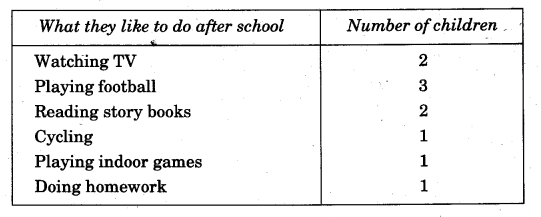
2.Practice Time: After School
Ask 10 of your friends about what they like to do most after school.
Ans.
Page 164
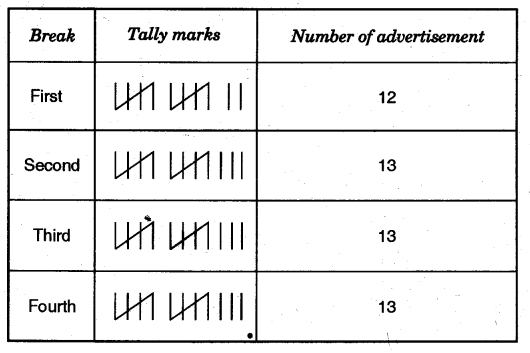
Ad Mad!!
Ragini loves to watch cartoons on television. One day she thought of counting the number of ads during the breaks. She found that in each break there were
14 advertisements. In 10 of those ads there were children as actors.
(a)Why do you think that children are used in so many ads?
(b)Use tally marks to count the number of ads during a short break in a programme.
Were there ads during the news programme?
Ans. (a) Children are used in so many advertisements because cartoons are mostly watched by children.
(b) Tally marks used to count the number of ads can be as follows; assuming there are 14 ads in a break.

Yes, during news programmes also, there are ads.
NCERT 5th Maths Chapter 12, class 5 Maths Chapter 12 solutions
Try Yourself
Next time when you watch your favourite TV programme, count the number of advertisements during each break. Use tally marks. Put a dot below the tally when you find children in any advertisement.
1.Compare with your friends. Do you get different answers?
Ans. The tally mark is as follows:
When I compared my chart with my friend’s chart, I found difference. The other friend was not watching the same programme.
Page 165
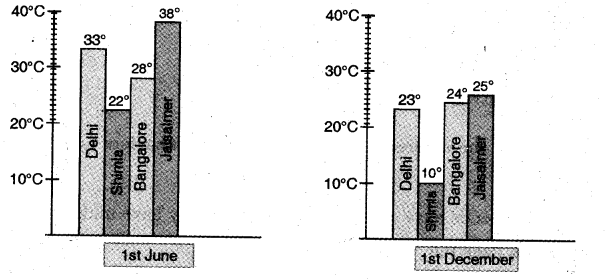
Hot and Cold
Have you seen the weather report on TV or in a newspaper? These are two bar Charts. These show the highest temperature (in degree Celsius) in four cities, on two different days. The cities are Delhi, Shimla, Bangalore and Jaisalmer.
Find out from the bar chart:
1.Which city is the hottest on 1 June?
Ans. Jaisalmer.
2.Which city is the coldest on 1 December?
Ans. Shimla.
3.Which city shows httle change in temperature on the two days: 1 June and 1 December?
Ans. Bangalore
Lowest change: 28 – 24 = 4°C.
Try Yourself
On any one day, choose any three cities and record their temperature from the TV or newspaper.
1.Make a bar chart in you!’ notebook and ask your friends a few questions about it. See if they understand your chart!
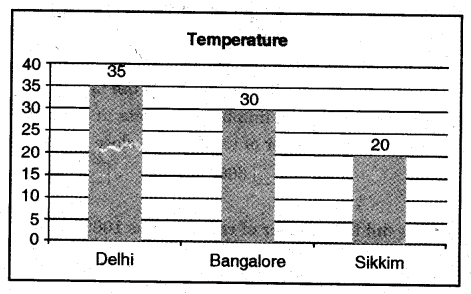
Ans. Let us show the highest temperature (in degrees Celsius) in three cities: Delhi, Bangalore and Sikkim.
10th April 1
Now answer these:
(а)Which city is the hottest on 10th April?
Ans. Delhi.
(b)Which city is the coolest on 10th April?
Ans. Sikkim.
(c)What is the difference in temperatures in Bangalore and Sikkim on 10th April?
Ans. 10°C.
Since my friends have answered correctly so they have understood the chart.
Page 166
Rabbits in Australia
Earlier there were no rabbits in Australia. Rabbits were brought to Australia around the year 1780. At that time there were no animals in Australia which ate rabbits. So the rabbits began to multiply at a very fast rate. Imagine what they did to the crops!
The table shows how rabbits grew every year.
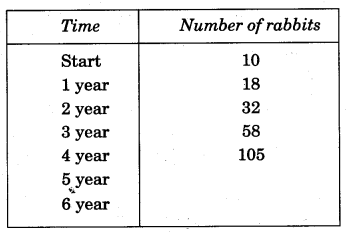
1.After each year the number of rabbits was
(а)A little less than double the number of rabbits in the last year.
(b)Double the number in last year.
(c)8 more than the number in the last year.
(d)More than double the number of rabbits in the last year.
Ans.(a) A little less than double the number of rabbits in the last year.
2.At the end of year 6, the number of rabbits was close to

Ans.400
3.After which year did the number of rabbits cross 1000?
Ans. After 1788.
NCERT 5th Maths Chapter 12, class 5 Maths Chapter 12 solutions
Page 167
Family Tree
Madhav went to a wedding along with his parents. He met many relatives there. But he did not know everyone. He met his mother’s grandfather, but found that her grandmother is not alive. He also found that her Dadi’s mother (grandmother’s mother) is still alive, and more than a hundred years old. Madhav got confused. He couldn’t imagine his mother’s grandmother’s mother! So, Madhav’s mother made a family tree for him.
Madhav’s mother helped him understand his family with the help of this drawing. You can also find about your older generations using such a family tree.
1.How many grandparents in all does Shobna have?
Ans. Four.
2.How many great, great grandparents in all does Madhav have?
Ans. Eight.
3.How many elders will be in the VII generation of his family?
Ans. 32
VI generation = 8 x 2 = 16
VII generation = 16 x 2 = 32
4.If he takes his family tree forward in which generation will he find 128 elders?
Ans. VIII generation = 32 x 2 = 64 IX generation = 64 x 2 = 128
Page 168
Growth Chart of a Plant
1. Amit sowed a few seeds of moong dal in the ground. The height of the plant grew to 1.4 cm in the first four days. After that it started growing faster.
Amit measured the height of the plant after every four days and put a dot on the chart. For example if you look at the dot marked on the fourth day, you can see bn the left side scale that it is 1.4 cm high.
Ans.
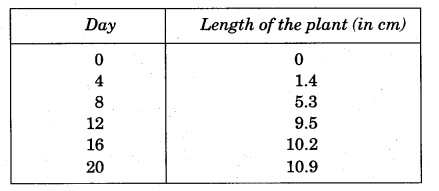
2.Now look at the height of each dot in cm and check from the table if he has marked the dots correctly.
Ans. Yes, he has marked the dots correctly.
Find Out From the Growth Chart
(а)Between which days did the length of the plant change the most?
(i) 0-4 (ii) 4-8 (iii) 8-12 (iv) 12-16 (v) 16 – 20
Ans. (iii) 8-12
(b)What could be the length of this plant on the 14th day? Guess.
(i) 8.7 cm (ii) 9.9 cm (iii) 10.2 cm (iv) 10.5 cm
Ans. (ii) 9.9 cm
(c) Will the plant keep growing all the time? What will be its length on the 100th day? Make a guess!
Ans. No, I think its length would be about 17-18 cm on 100th day.
NCERT Solutions for 5th Class Maths Chapter 12- Smart Charts: Download PDF
NCERT Solutions for 5th Class Maths Chapter 12- Smart Charts
Download PDF: NCERT Solutions for 5th Class Maths Chapter 12- Smart Charts PDF
Chapterwise NCERT Solutions for Class 5 Maths :
- Chapter 1: The fish Tale
- Chapter 2: Shapes and Angles
- Chapter 3: How Many Squares?
- Chapter 4: Parts and Wholes
- Chapter 5: Does it Look the Same?
- Chapter 6: Be My Multiple, I’ll be Your Factor
- Chapter 7: Can You See the Pattern?
- Chapter 8: Mapping Your Way
- Chapter 9: Boxes and Sketches
- Chapter 10: Tenths and Hundredths
- Chapter 11: Area and its Boundary
- Chapter 12: Smart Charts
- Chapter 13: Ways to Multiply and Divide
- Chapter 14: How Big? How Heavy?
About NCERT
The National Council of Educational Research and Training is an autonomous organization of the Government of India which was established in 1961 as a literary, scientific, and charitable Society under the Societies Registration Act. Its headquarters are located at Sri Aurbindo Marg in New Delhi. Visit the Official NCERT website to learn more.