
Class 10: Maths Chapter 6 solutions. Complete Class 10 Maths Chapter 6 Notes.
Maharashtra Board Solutions for Class 10-Maths (Part 1): Chapter 6- Statistics
Maharashtra Board 10th Maths Chapter 6, Class 10 Maths Chapter 6 solutions
Practice Set 6.1
Question 1.
The following table shows the number of students and the time they utilized daily for their studies. Find the mean time spent by students for their studies by direct method.
Solution: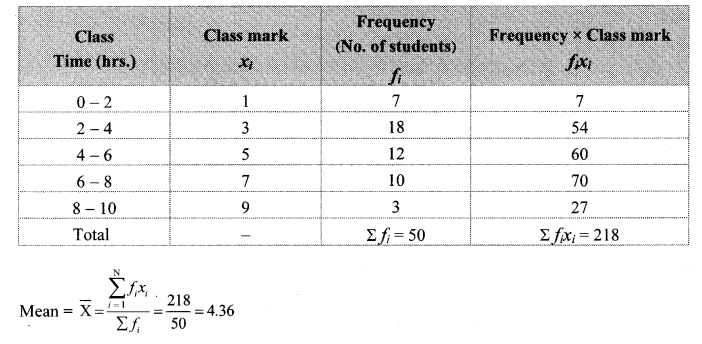
∴ The mean of the time spent by the students for their studies is 4.36 hours.
Question 2.
In the following table, the toll paid by drivers and the number of vehicles is shown. Find the mean of the toll by ‘assumed mean’ method.
Solution:
Let us take the assumed mean (A) = 550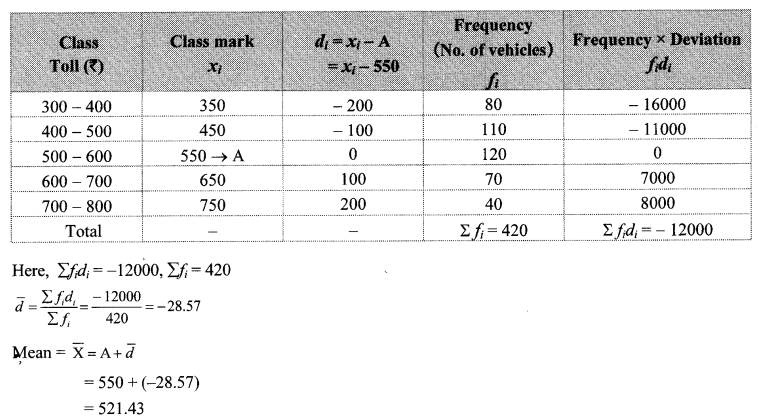
∴ The mean of the toll paid by the drivers is ₹ 521.43.
Question 3.
A milk centre sold milk to 50 customers. The table below gives the number of customers and the milk they purchased. Find the mean of the milk sold by direct method.
Solution: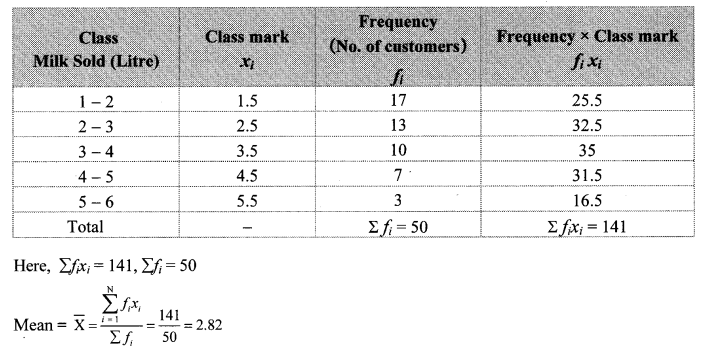
∴ The mean of the milk sold is 2.82 litres.
Question 4.
A frequency distribution table for the production of oranges of some farm owners is given below. Find the mean production of oranges by ‘assumed mean’ method.
Solution:
Let us take the assumed mean (A) = 37.5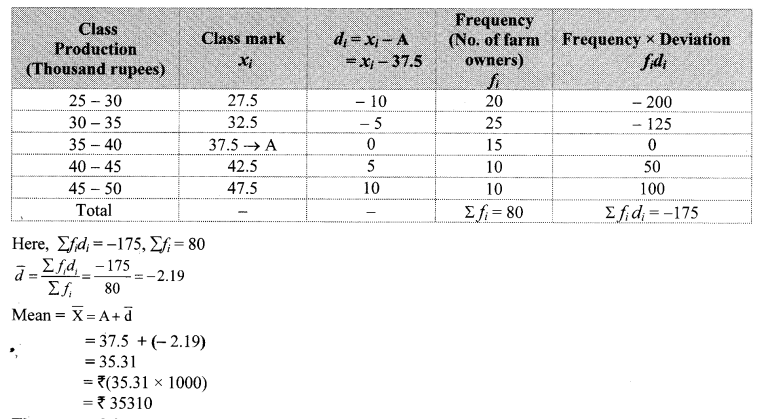
∴ The mean of the production of oranges is ₹ 35310.
Question 5.
A frequency distribution of funds collected by 120 workers in a company for the drought affected people are given in the following table. Find the mean of he funds by ‘step deviation’ method.
Solution:
Here, we take A = 1250 and g = 500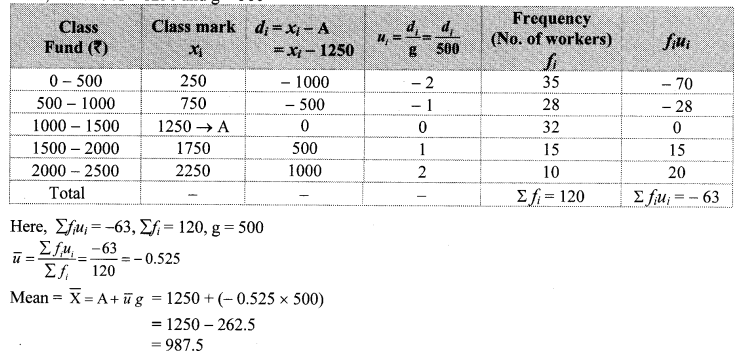
∴ The mean of the funds collected is ₹ 987.5.
Question 6.
The following table gives the information of frequency distribution of weekly wages of 150 workers of a company. Find the mean of the weekly wages by ‘step deviation’ method.
Solution:
Here, we take A = 2500 and g = 1000.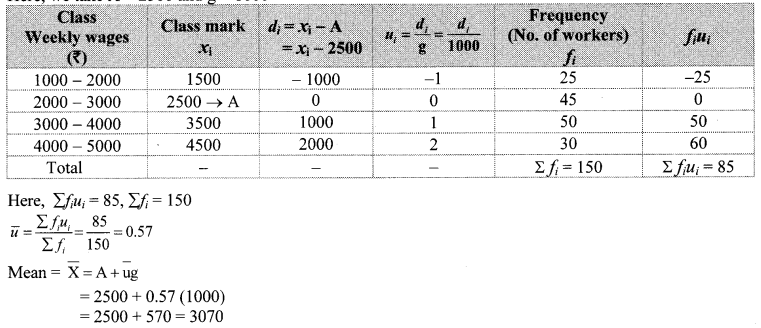
∴ The mean of the weekly wages is ₹ 3070.
Question 1.
The daily sale of 100 vegetable vendors is given in the following table. Find the mean of the sale by direct method. (Textbook pg. no. 133 and 134)
Solution: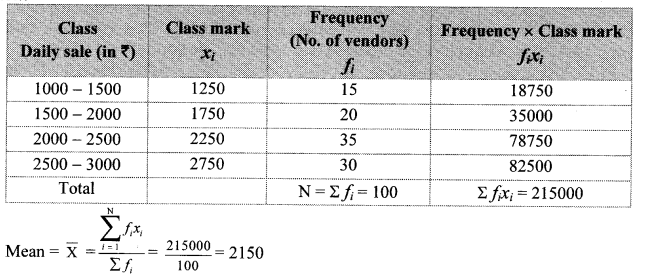
The mean of the sale is 2150.
Question 2.
The amount invested in health insurance by 100 families is given in the following frequency table. Find the mean of investments using direct method and assumed mean method. Check whether the mean found by the two methods is the same as calculated by step deviation method (Ans: ₹ 2140). (Textbook pg. no. 135 and 136)
Solution: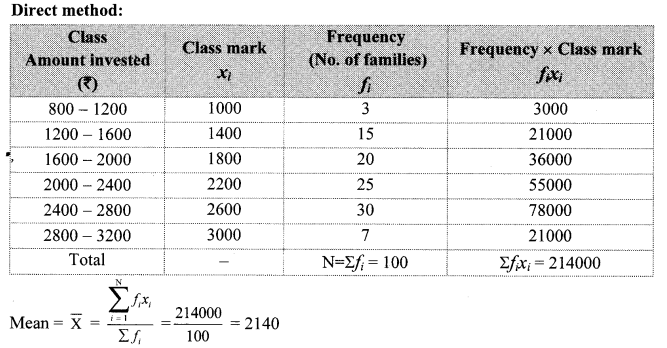
∴ The mean of investments in health insurance is ₹ 2140.
Assumed mean method: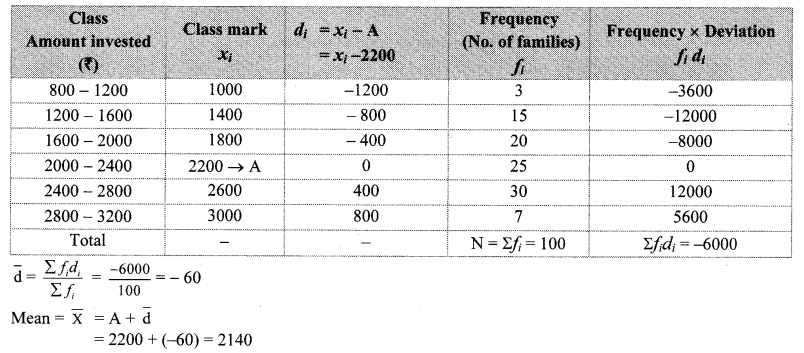
∴ The mean of investments in health insurance is ₹ 2140.
∴ Mean found by direct method and assumed mean method is the same as calculated by step deviation method.
Question 3.
The following table shows the funds collected by 50 students for flood affected people. Find the mean of the funds.
If the number of scores in two consecutive classes is very low, it is convenient to club them. So, in the above example, we club the classes 0 – 500, 500 – 1000 and 2000 – 2500, 2500 – 3000. Now the new table is as follows
i. Solve by direct method.
ii. Verily that the mean calculated by assumed mean method is the same.
iii. Find the mean in the above example by taking A = 1750. (Textbook pg. no. 137)
Solution:
i. Direct method: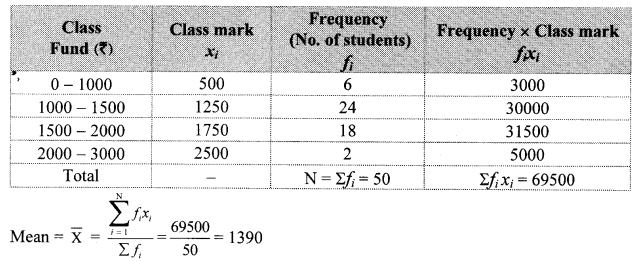
∴ The mean of the funds is ₹ 1390.
ii. Assumed mean method:
Here, A = 1250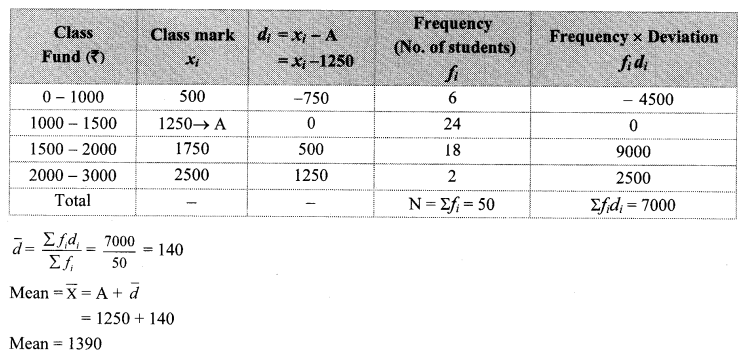
∴ The mean calculated by assumed mean method is the same.
iii. Step deviation method:
Here, we take A = 1750 and g = 250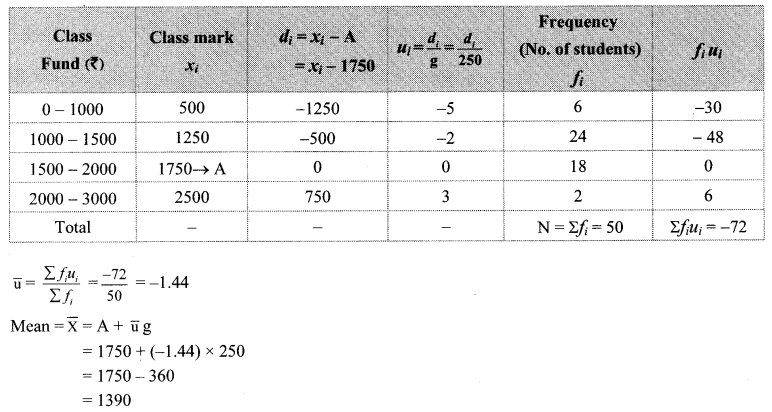
∴ The mean of the funds is ₹ 1390.
Practice Set 6.2
Question 1.
The following table shows classification of number of workers and the number of hours they work in a software company. Find the median of the number of hours they work.
Solution: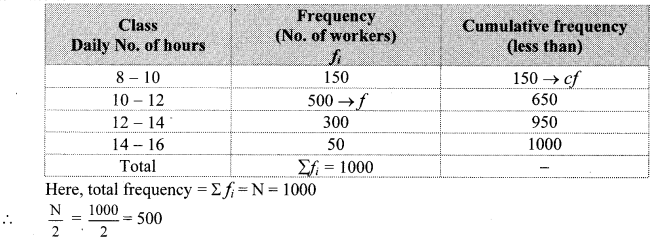
Cumulative frequency which is just greater than (or equal) to 500 is 650.
∴ The median class is 10 – 12.
Now, L = 10, f = 500, cf = 150, h = 2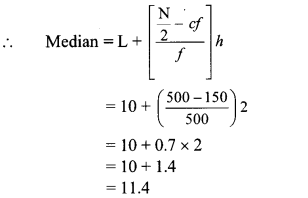
∴ The median of the number of hours the workers work is 11.4 hours.
Question 2.
The frequency distribution table shows the number of mango trees in a grove and their yield of mangoes. Find the median of data.
Solution: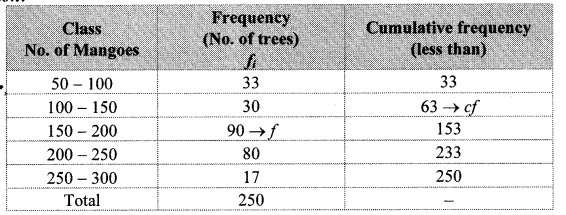
Here, total frequency = ∑fi = N = 250
∴ N2 = 2502 = 125
Cumulative frequency which is just greater than (or equal) to 125 is 153.
∴ The median class is 150 – 200.
Now, L = 150, f = 90, cf = 63, h = 50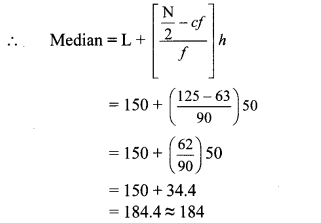
∴ The median of the given data is 184 mangoes (approx).
Question 3.
The following table shows the classification of number of vehicles and their speeds on Mumbai-Pune express way. Find the median of the data.
Solution: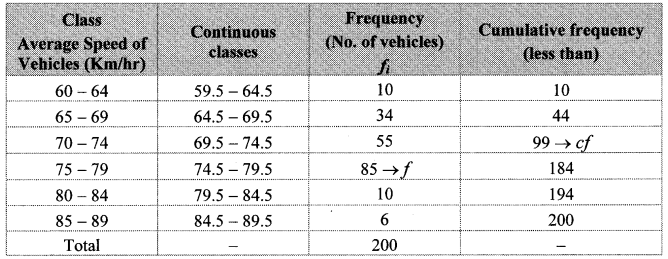
Here, total frequency = ∑fi = N = 200
∴ N2 = 2002 = 100
Cumulative frequency which is just greater than (or equal) to 100 is 184.
∴ The median class is 74.5 – 79.5.
Now, L = 74.5, f = 85, cf = 99, h = 5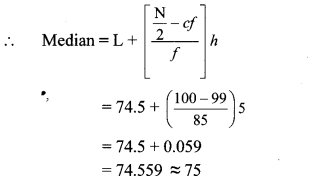
∴ The median of the given data is 75 km/hr (approx.).
Question 4.
The production of electric bulbs in different factories is shown in the following table. Find the median of the productions.
Solution: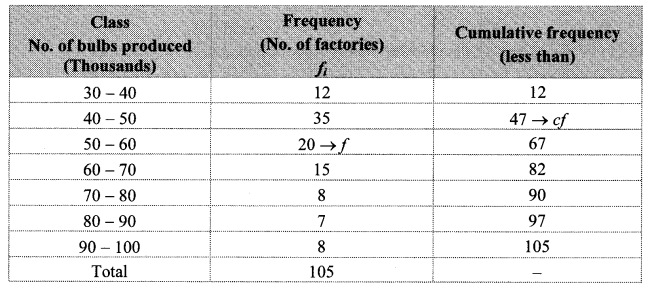
Cumulative frequency which is just greater than (or equal) to 52.5 is 67.
∴ The median class is 50 – 60.
Now, L = 50, f = 20, cf = 47, h = 10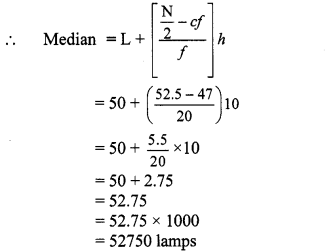
∴ The median of the productions is 52750 bulbs (approx.).
Question 1.
If the number of scores is odd, then the (n+12)th score is the median of the data. That is, the number of scores below as well as above Kn+12 is n−12 Verify the fact by taking n = 2m + I. (Textbk pg. no. 139)
Solution:
The sequence of the terms of scores is 1,2, 3, …….., m, m + 1, m + 2, …, 2m + 1
Thus, we have to prove that m + 1 is the middle term if the number of scores is 2m + 1
i.e. to prove
number of terms from 1 to m = number of terms from m + 2 to 2m + 1 …(i)
Consider the L.H.S. of equation (i)
The sequence is an A.P. with a = 1,d = 1, tn1 = m
tn1 = a + (n1 – 1) d
∴ m = 1 + (n1 – 1)1
∴ m = 1 + n1 – 1
∴ m = n1
Consider the R.H.S. of equation (ii)
The sequence is an A.P. with a = m + 2, d = 1, tn2 = 2m + 1
tn2 = a + (n2 – 1)d
∴ 2m + 1 = m + 2 + (n2 – 1)1
∴ 2m + 1 = m + n2 + 1
∴ m = n2
∴ number of terms from 1 to m = number of terms from m + 2 to 2m + 1 = m = n−12
∴ m + 1 is the middle term if the number of scores is 2m + 1.
Question 2.
If the number of the scores is even, then the mean of the middle two terms is the median. This is because the number of terms below Kn2 and above Kn+22 is equal, which is n−22. Verify this by taking n = 2m. (Textbook pg. no. 139)
Solution: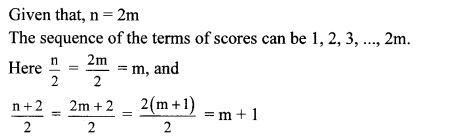
The sequence of the terms of scores is 1, 2, 3 … m – 1, m, m + 1, m + 2,…., 2m
Thus, we have to prove that m and m + 1 are the middlemost terms if the number of scores is 2m.
i.e. to prove
number of terms from 1 to m – 1 = number of terms from m + 2 to 2m …(i)
Consider the L.H.S. of equation (i)
The sequence is an A.P. with a = 1, d = 1, tn1 = m – 1
tn1 = a + (n1 – 1)d
∴ m – 1 = 1 + (n1 – 1)1
∴m – 1 = 1 + n1 – 1
∴ n1 = m – 1
Consider the R.H.S. of equation (i)
The sequence is an A.P. with a = m + 2, d = 1, tn2= 2m
tn2= a + (n2 – 1) d
∴ 2m = m + 2 + (n2 – 1)1
∴ 2m = m + 2 + n2 – 1
∴ n2 = m – 1
∴ number of terms from 1 to m – 1 = number of terms from m + 2 to 2m = m – 1 = n−22
∴ m and m + 1 are the middlemost terms if the number of scores is 2m.
Practice Set 6.3
Question 1.
The following table shows the information regarding the milk collected from farmers on a milk collection centre and the content of fat in the milk, measured by a lactometer. Find the mode of fat content.
Solution: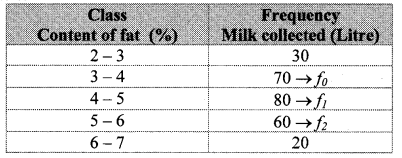
Here, the maximum frequency is 80.
∴ The modal class is 4 – 5.
L = lower class limit of the modal class = 4
h = class interval of the modal class = 1
f1 = frequency of the modal class = 80
f0 = frequency of the class preceding the modal class = 70
f2 = frequency of the class succeeding the modal class = 60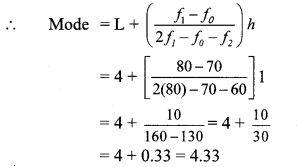
∴ The mode of the fat content is 4.33%.
Question 2.
Electricity used by some families is shown in the following table. Find the mode of use of electricity.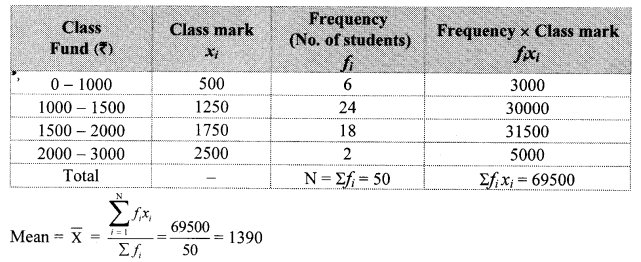
Solution: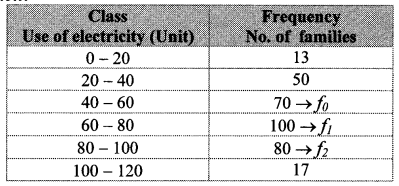
Here, the maximum frequency is 100.
∴ The modal class is 60 – 80.
L = lower class limit of the modal class = 60
h = class interval of the modal class = 20
f1 = frequency of the modal class = 100
f0 = frequency of the class preceding the modal class = 70
f2 = frequency of the class succeeding the modal class = 80
∴ The mode of use of electricity is 72 units.
Question 3.
Grouped frequency distribution of supply of milk to hotels and the number of hotels is given in the following table. Find the mode of the supply of milk.
Solution: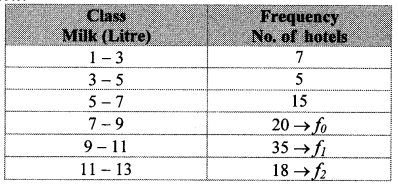
Here, the maximum frequency is 35.
∴ The modal class is 9 – 11.
L = lower class limit of the modal class = 9
h = class interval of the modal class = 2
f1 = frequency of the modal class = 35
f0 = frequency of the class preceding the modal class = 20
f2 = frequency of the class succeeding the modal class = 18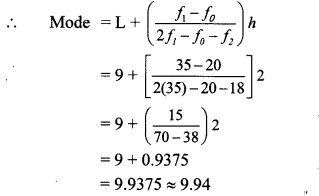
∴ The mode of the supply of milk is 9.94 litres (approx.).
Question 4.
The following frequency distribution table gives the ages of 200 patients treated in a hospital in a week. Find the mode of ages of the patients.
Solution: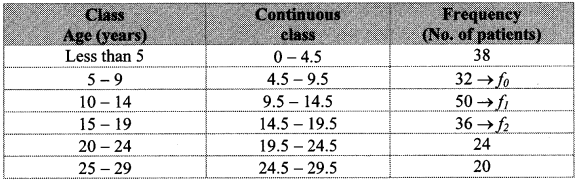
Here, the maximum frequency is 50.
The modal class is 9.5 – 14.5.
L = lower class limit of the modal class = 9.5
h = class interval of the modal class = 5
f1 = frequency of the modal class = 50
f0 = frequency of the class preceding the modal class = 32
f2 = frequency of the class succeeding the modal class = 36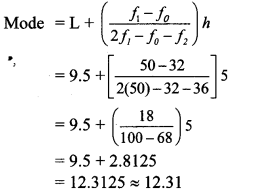
∴ The mode of the ages of the patients is 12.31 years (approx.).
Practice Set 6.4
Question 1.
Draw a histogram of the following data.
Solution: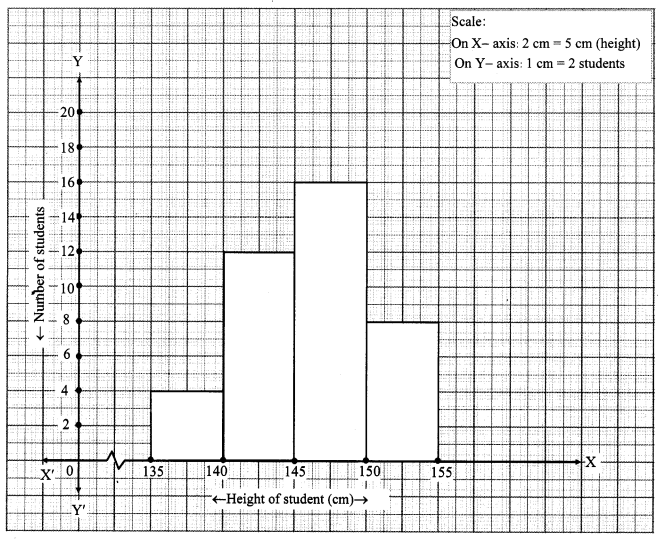
Question 2.
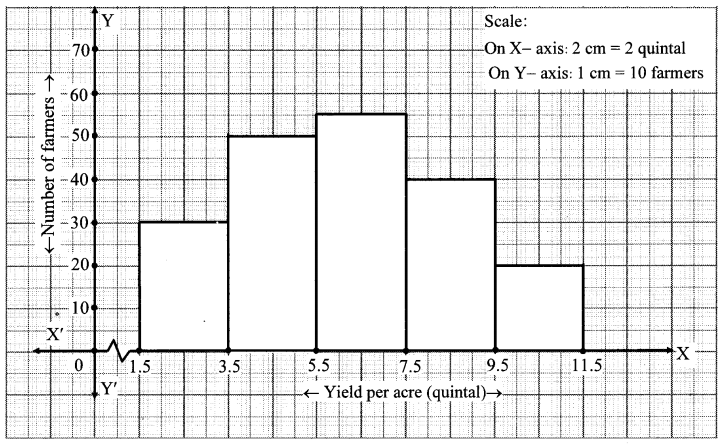
The table below shows the yield of jowar per acre. Show the data by histogram.
Solution: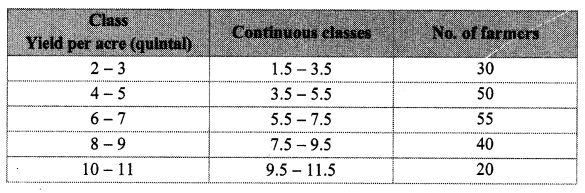
Question 3.
In the following table, the investment made by 210 families is shown. Present it in the form of a histogram.
Solution: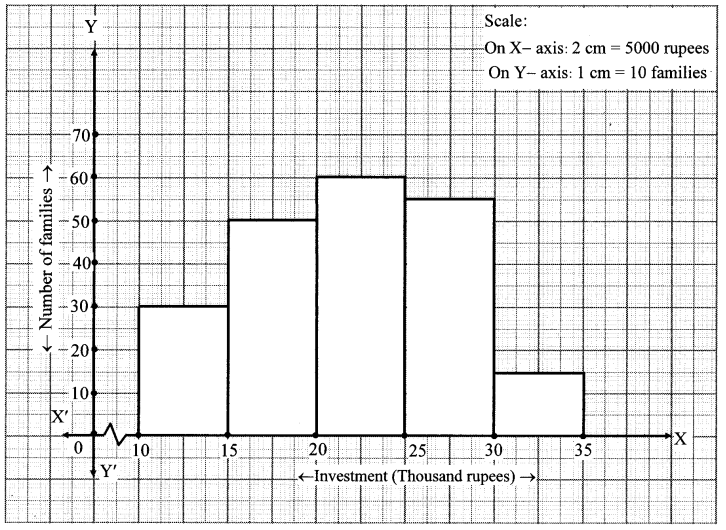
Question 4.
Time allotted for the preparation of an examination by some students is shown in the table. Draw a histogram to show the information.
Solution: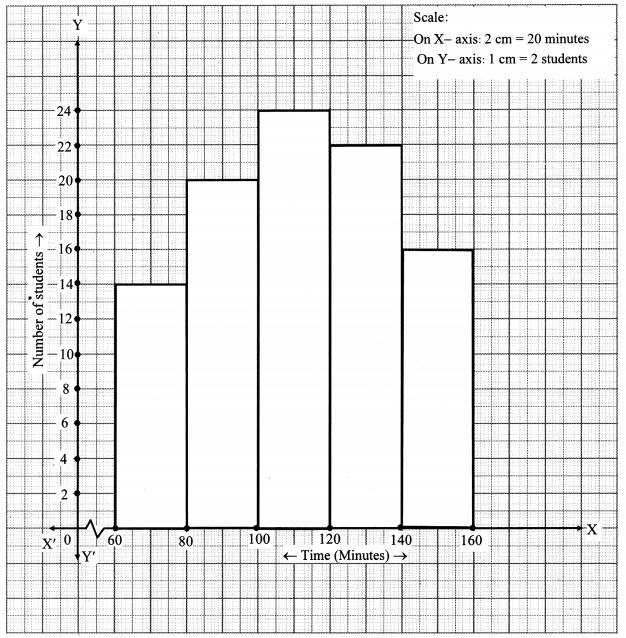
Practice Set 6.5
Question 1.
Observe the following frequency polygon and write the answers of the questions below it.
i. Which class has the maximum number of students?
ii. Write the classes having zero frequency.
iii. What is the class mark of the class, having frequency of 50 students?
iv. Write the lower and upper class limits of the class whose class mark is 85.
v. How many students are in the class 80 – 90?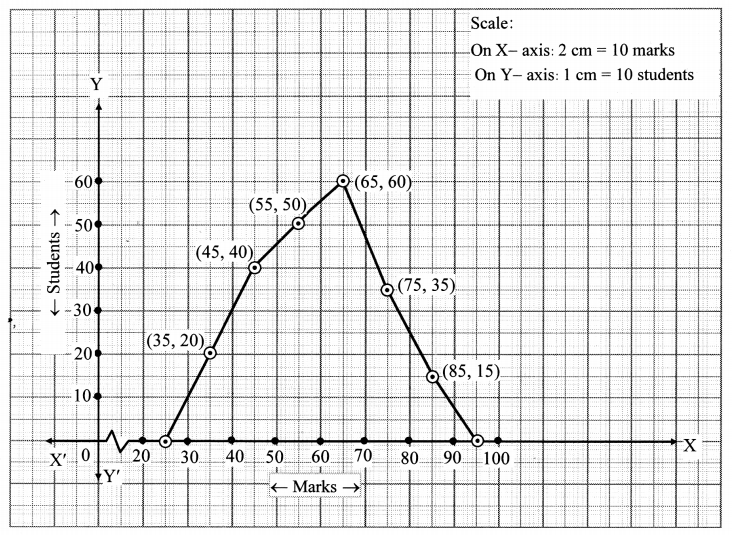
Solution:
i. The class 60 – 70 has the maximum number of students.
ii. The classes 20 – 30 and 90 – 100 have frequency zero.
iii. The class mark of the class having 50 students is 55.
iv. The lower and upper class limits of the class having class mark 85 are 80 and 90 respectively.
v. There are 15 students in the class 80 – 90.
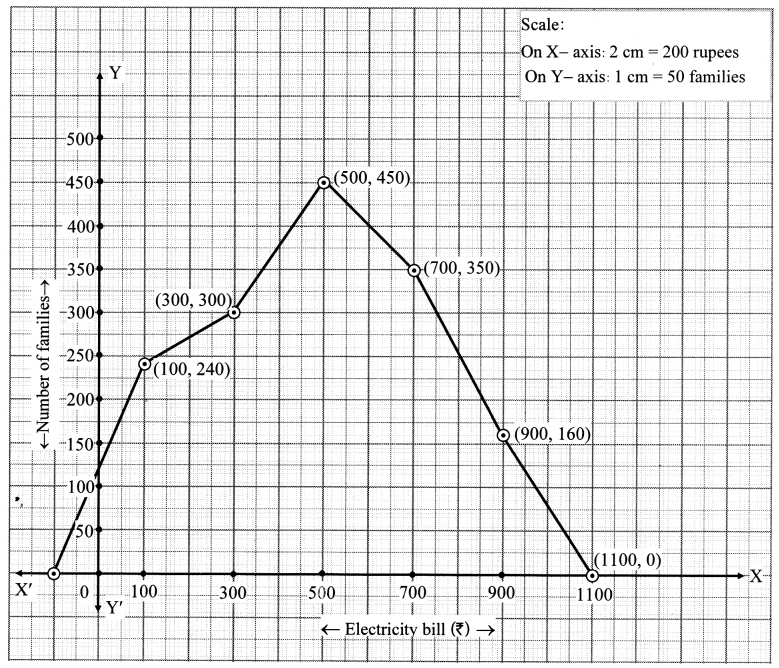
Question 2.
Show the following data by a frequency polygon.
Solution: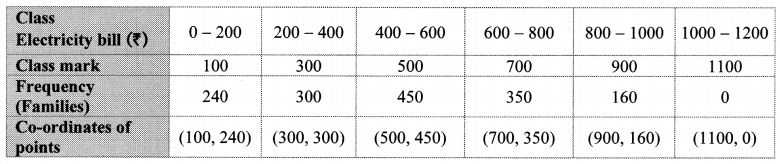
Question 3.
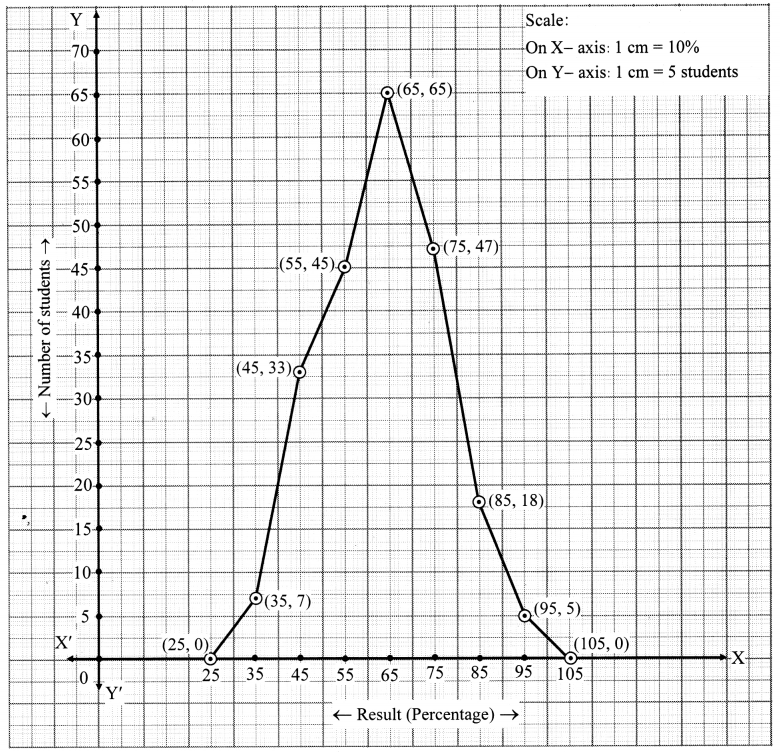
The following table shows the classification of percentages of marks of students and the number of students. Draw a frequency polygon from the table.
Solution: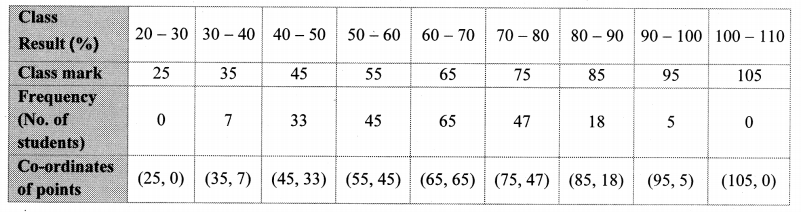
Practice Set 6.6
Question 1.
The age group and number of persons, who donated blood in a blood donation camp is given below.
Draw a pie diagram from it.
Solution:
Total number of persons = 80 + 60 + 35 + 25 = 200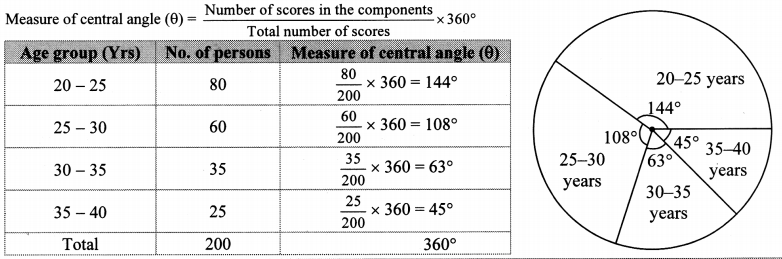
Question 2.
The marks obtained by a student in different subjects are shown. Draw a pie diagram showing the information.
Solution:
Total marks obtained = 50 + 70 + 80 + 90 + 60 + 50 = 400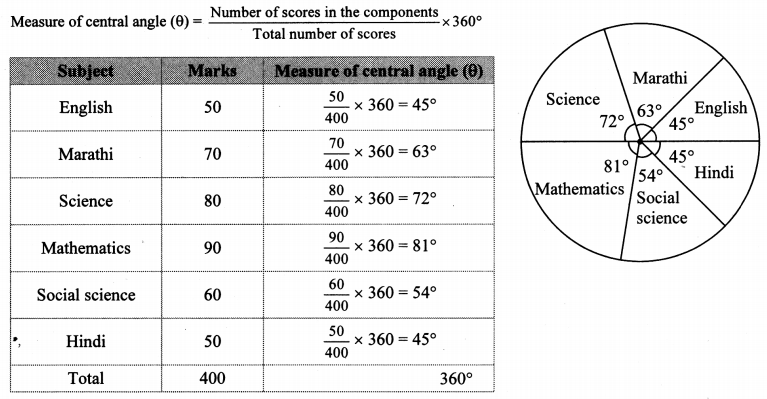
Question 3.
In a tree plantation programme, the number of trees planted by students of different classes is given in the following table. Draw a pie diagram showing the information.
Solution:
Total number of trees planted = 40 + 50 + 75 + 50 + 70 + 75 = 360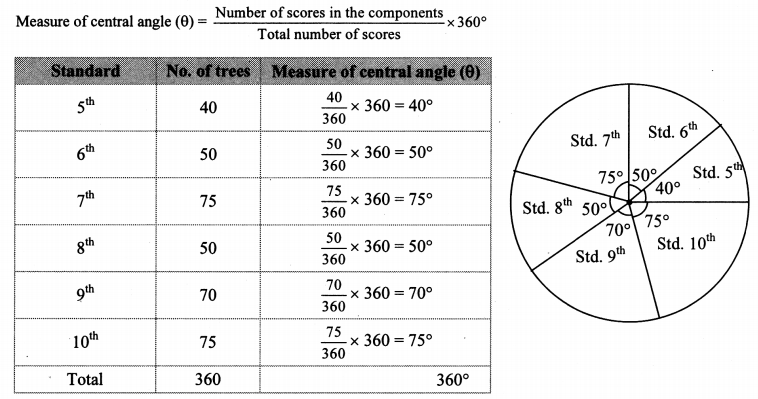
Question 4.
The following table shows the percentages of demands for different fruits registered with a fruit vendor. Show the information by a pie diagram.
Solution:
Total percentage = 30 + 15 + 25 + 20 + 10 = 100%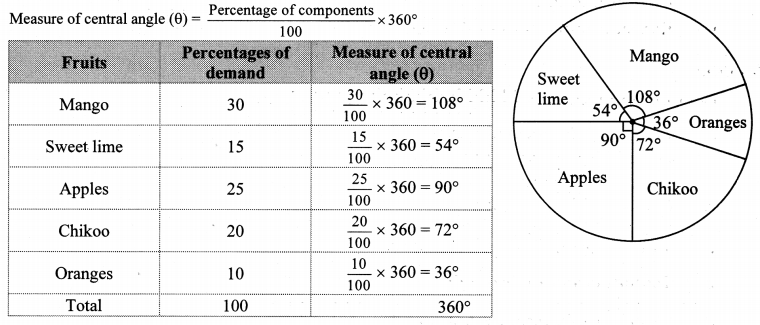
Question 5.
The pie diagram in the given figure shows the proportions of different workers in a town. Answer the following questions with its help.
i. If the total workers is 10,000, how many of them are in the field of construction?
ii. How many workers are working in the administration?
iii. What is the percentage of workers in production?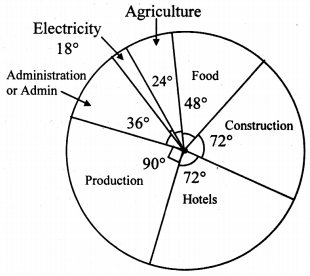
Solution: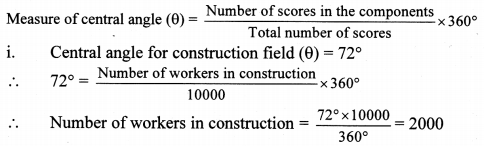
∴ There are 2000 workers working in the field of construction.
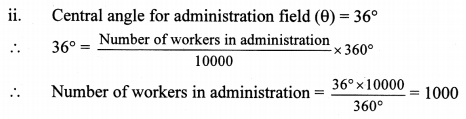
∴ There are 1000 workers working in the administration.
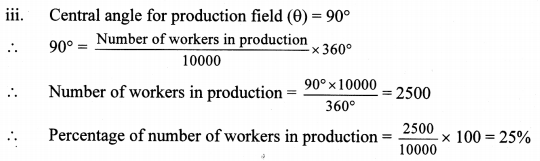
∴ 25% of workers are working in the production field.
Question 6.
The annual investments of a family are shown in the given pie diagram. Answer the following questions based on it.
i. If the investment in shares is ? 2000, find the total investment.
ii. How much amount is deposited in bank?
iii. How much more money is invested in immovable property than in mutual fund?
iv. How much amount is invested in post?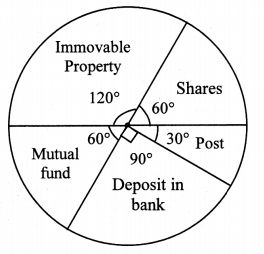
Solution: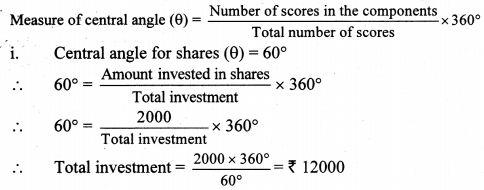
The total investment is ₹ 12000.
ii. Central angle for deposit in bank (θ) = 90°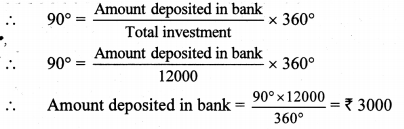
∴ The amount deposited in bank is ₹ 3000.
iii. Difference in central angle for immovable property and mutual fund (θ) = 120° – 60° = 60°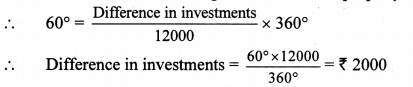
∴ ₹ 2000 more is invested in immovable property than in mutual fund.
iv. Central angle for post (θ) = 30°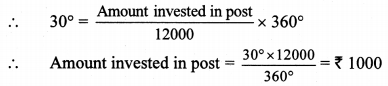
∴ The amount invested in post is ₹ 1000.
Download PDF
Maharashtra Board Solutions for Class 10-Maths (Part 1): Chapter 6- Statistics
Download PDF: Maharashtra Board Solutions for Class 10-Maths (Part 1): Chapter 6- Statistics PDF
Chapterwise Maharashtra Board Solutions Class 10 Maths (Part 1) :
- Chapter 1- Linear Equations in Two Variables
- Chapter 2- Quadratic Equations
- Chapter 3- Arithmetic Progression
- Chapter 4- Financial Planning
- Chapter 5- Probability
- Chapter 6- Statistics