
Class 7: Maths Chapter 17 solutions. Complete Class 7 Maths Chapter 17 Notes.
ML Aggarwal Solutions for Class 7 Maths Chapter 17- Data Handling
ML Aggarwal 7th Maths Chapter 17, Class 7 Maths Chapter 17 solutions
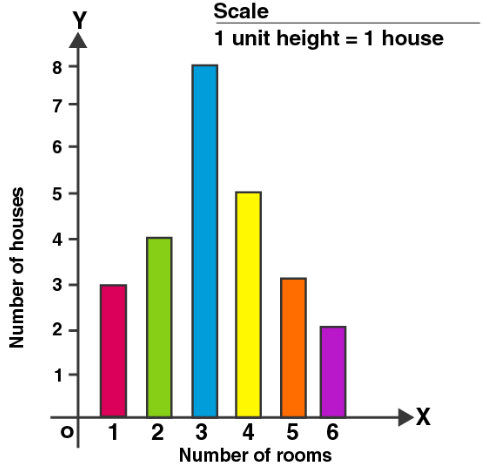
1. The number of rooms in 25 houses of a locality is as given below:
4, 3, 2, 6, 4, 3, 2, 1, 5, 3, 2, 3, 4, 3, 5, 1, 6, 1, 3, 4, 2, 3, 4, 3, 5
(i) Arrange the above data in ascending order.
(ii) Find the range of the data.
(iii) Construct a frequency distribution table for the above data.
(iv) Find the number of houses which have 4 or more than 4 rooms.
(v) Draw bar graph to represent the above data.
Solution:
(i) The ascending order of the above data is:
1, 2, 3, 4, 5, 6
(ii) The range of the data is:
Smallest data = 1
Highest data = 6
Range = 6 – 1 = 5
(iii) Frequency distribution table for the above data:
| Number of rooms | Tally marks | Number of houses(Frequency) |
| 123456 | IIIIIII III III IIIII IIIII | 348532 |
| Total | 25 |
(iv) Number of houses which have 4 or more rooms = 5 + 3 + 2 = 10
(v) The bar graph of the given data is:
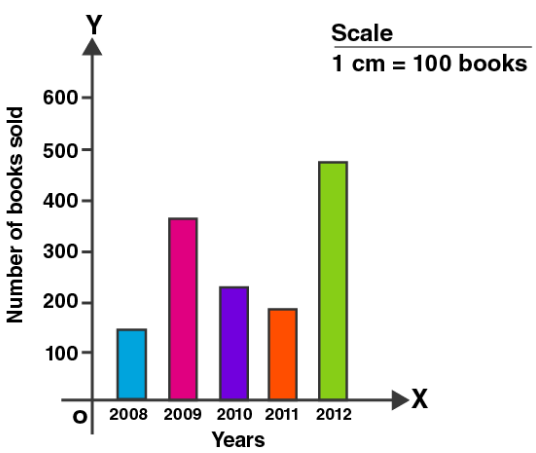
2. The given bar graph shows the number of books sold by a bookstore for five consecutive years. Read the bar graph and answer the following questions:
(i) About how many books were sold in 2008, 2009 and 2011 years?
(ii) In which years were about 475 books and 225 books sold?
Solution:
The above figure shows the number of books sold by the bookstore during 5 consecutive years.
(i) Number of books sold in 2008 = 140
Number of books sold in 2009 = 360
Number of books sold in 2011 = 180
(ii) In the year 2012, 475 books were sold and in year 2010, 225 books were sold.
3. Two hundred students of 6th and 7th class were asked to name their favorite colour so as to decide upon what should be the colour of their school building. The results are shown in the following table:
| Favorite colour | Red | Green | Blue | Yellow | Orange |
| Number of students | 43 | 19 | 55 | 49 | 34 |
Represent the given data on a bar graph.
Answer the following questions with the help of the bar graph:
(i) Which is the most preferred colour?
(ii) Which is the least preferred colour?
(iii) How many colours are there in all? What are they?
Solution:
Given:
Total number of students = 43 + 19 + 55 + 49 + 34 = 200
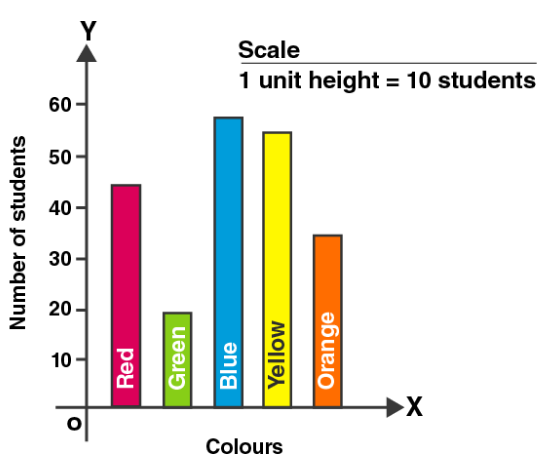
(i) The most preferred colour is Blue colour.
(ii) The least preferred colour is green colour.
(iii) There are 5 colours in all. They are red, green, blue, yellow, orange.
4. Sale of English and Hindi books in four consecutive years is given below:
| Years | 2008 | 2009 | 2010 | 2011 |
| English | 350 | 400 | 450 | 620 |
| Hindi | 500 | 525 | 600 | 650 |
Draw a double bar graph to represent the above data and answer the following questions:
(i) In which year was the difference in the sale of two language books least?
(ii) Can you say that the demand for English books rose faster? Justify your answer.
Solution:
The bar graph is as follows:
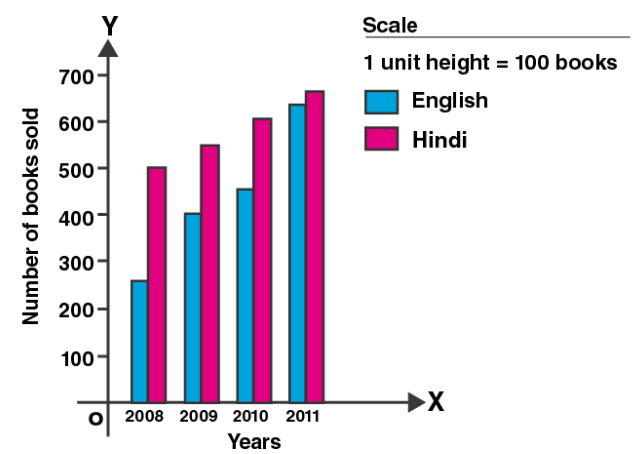
(i) In the year 2011, the difference in the sale of two language books i.e., 650 – 620 = 30 which is the least sale.
(ii) Yes, the demand for sale of English books rose faster, 620 – 350 = 170
And increase in sale of Hindi books is 650 – 500 = 150
Hence, sale in English books is faster.
5. Consider the following data collected from a survey of a colony:
| Favorite sport | Cricket | Basketball | Swimming | Hockey | Athletics |
| Watching | 1240 | 470 | 510 | 430 | 250 |
| Participating | 620 | 320 | 320 | 250 | 110 |
Draw a double bar graph choosing an appropriate scale.
Answer the following questions using the bar graph:
(i) Which sports is most popular?
(ii) Which is more preferred, watching or participating in sports?
Solution:
The bar graph is as follows:
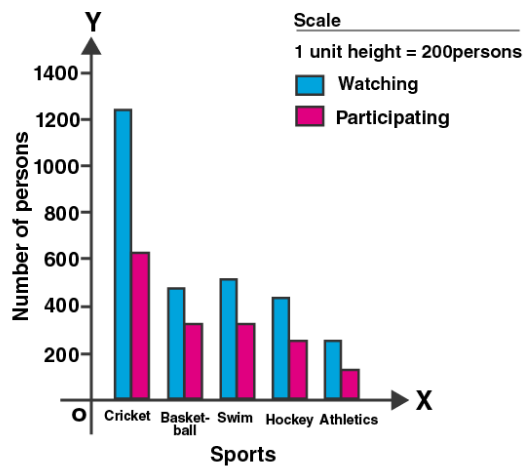
(i) Cricket is the most popular sport.
(ii) Watching is more preferred.
6. Find the mean of the following data:
(i) 40, 30, 30, 0, 26, 60
(ii) 3, 5, 7, 9, 11, 13, 15
Solution:
(i) Let us find the mean of 40, 30, 30, 0, 26, 60
Number of data (n) = 6
So,
Mean = (40 + 30 + 30 + 0 + 26 + 60)/6
= 186/6
= 31
(ii) Let us find the mean of 3, 5, 7, 9, 11, 13, 15
Number of data (n) = 7
So,
Mean = (3 + 5 + 7 + 9 + 11 + 13 + 15)/7
= 63/7
= 9
7. Find the mean of the first five whole numbers.
Solution:
We know that the first five whole numbers are:
0, 1, 2, 3, 4
So,
Mean = (0 + 1 + 2 + 3 + 4)/5
= 10/5
= 2
Download PDF
ML Aggarwal Solutions for Class 7 Maths Chapter 17- Data Handling
Download PDF: ML Aggarwal Solutions for Class 7 Maths Chapter 17- Data Handling PDF
Chapterwise ML Aggarwal Solutions for Class 7 Maths :
- Chapter 1- Integers
- Chapter 2- Fractions and Decimals
- Chapter 3- Rational Numbers
- Chapter 4- Exponents and Powers
- Chapter 5- Sets
- Chapter 6- Ratio and Proportion
- Chapter 7- Percentage and Its Applications
- Chapter 8- Algebraic Expressions
- Chapter 9- Linear Equations and Inequalitie
- Chapter 10- Lines and Angles
- Chapter 11- Triangles and its Properties
- Chapter 12- Congruence of Triangles
- Chapter 13- Practical Geometry
- Chapter 14- Symmetry
- Chapter 15- Visualising Solid Shapes
- Chapter 16- Perimeter and Area
- Chapter 17- Data Handling
About ML Aggarwal
M. L. Aggarwal, is an Indian mechanical engineer, educator. His achievements include research in solutions of industrial problems related to fatigue design. Recipient Best Paper award, Manipal Institute of Technology, 2004. Member of TSTE.